The 2026 Kumamoto Earthquake (July 28, 2026): Limitations of Preliminary Epicenter Locations
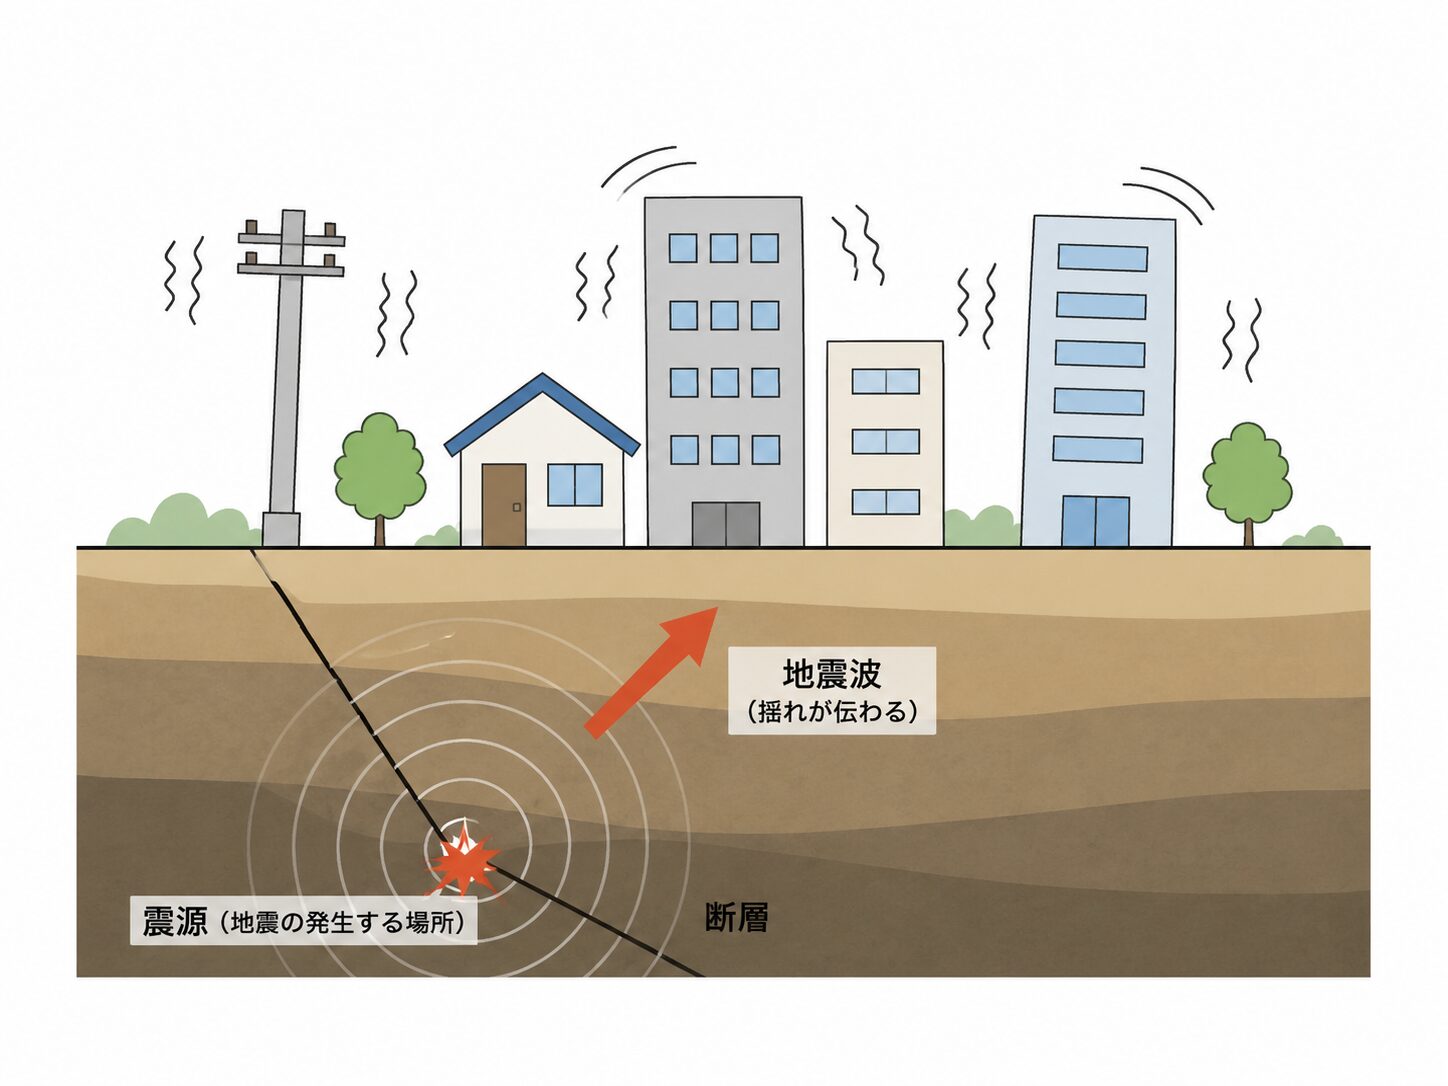
To understand where an earthquake occurs, hypocenter data are essential. A hypocenter is the point underground where rock failure begins. Investigating how this rupture propagates through space provides important clues for understanding the earthquake rupture process.
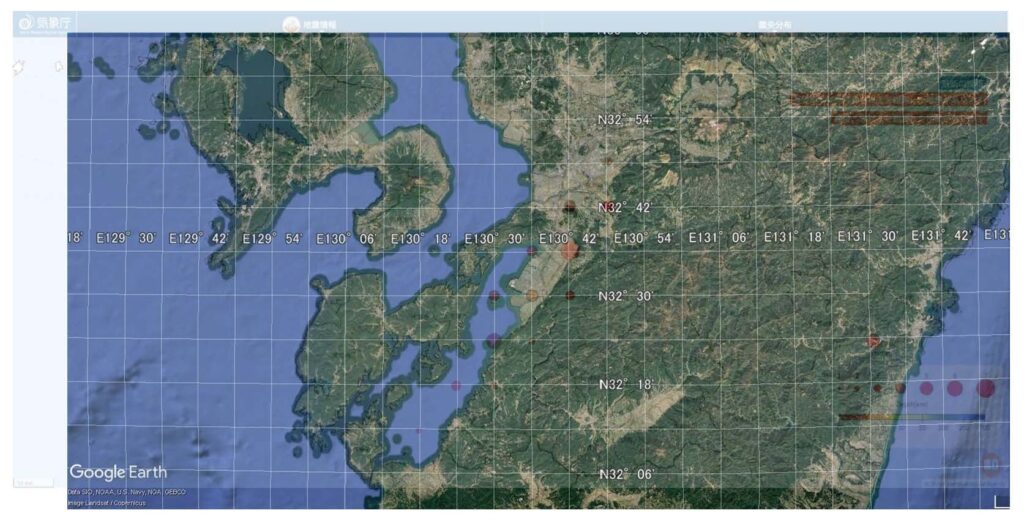
The figure above is an overlay of latitude–longitude grid lines from Google Maps on the epicenter distribution map published by the Japan Meteorological Agency (JMA). The cluster of red circles in the center represents the preliminary epicenter locations of the Reiwa 8 (2026) Kumamoto Earthquake sequence that occurred in July 2026.
As the figure clearly shows, the epicenters are plotted on a grid with intervals of 0.1 degrees (approximately 10 km). In these preliminary reports, the origin time, maximum seismic intensity, magnitude, and focal depth are provided, whereas the numerical latitude and longitude coordinates are not explicitly listed.
Displaying epicenters on such a coarse grid can create the illusion that earthquakes are aligned along only four directions: north–south, east–west, northeast–southwest, and northwest–southeast. This visual pattern may lead to the mistaken impression that seismicity is organized in a regular geometric arrangement. In reality, however, this apparent alignment is largely an artifact of the display method rather than a reflection of the true hypocenter distribution.
Providing near-real-time epicenter maps immediately after a major earthquake is extremely valuable for both disaster response and scientific research, and it demonstrates the remarkable progress made in modern seismic observation and information-processing technology. Nevertheless, it is equally important to recognize the limitations and display characteristics of these preliminary maps when interpreting the distribution of earthquake activity.